
When learning how to analyse a suburb property report, it’s easy to focus on the biggest growth figure and miss what it actually measures. Unfamiliar metrics and conflicting figures can make a report difficult to interpret, but a single statistic rarely tells the whole story.
Look beyond the headline and ask what each figure measures, when the data was collected and whether it fits your purpose. A median price, for example, is more useful when considered alongside sales activity, days on market, rental conditions and the period covered.
This guide explains how to identify relevant metrics, check data dates and definitions, and make sense of differences between sources. Treat report findings as evidence, not a verdict: they provide context for a property decision, but they’re only one part of a careful assessment. You’ll learn how to connect suburb-level trends with the specific property and decision in front of you.
Key Takeaways
- Start with the decision you need to make, then focus on the report measures that can help inform it.
- To understand how to analyse a suburb property report, record who produced it and the dates and definitions behind its figures.
- When figures differ across reports, compare matching property types, areas and time periods before drawing conclusions.
- Use suburb trends differently depending on whether you’re buying, selling or considering an investment.
- Summarise the signals and their limitations, then identify what still needs property-specific assessment or advice.
How to Analyse a Suburb Property Report: What the Figures Can Tell You
A suburb property report summarises selected property and local-market indicators for a defined area. It can show broad patterns, such as changes in sale prices or rents, but it can’t tell you the condition or precise value of a particular home.
A suburb report is a snapshot of selected market and local-area data, not an assessment of an individual property. An appraisal estimates a property’s likely selling price; a formal valuation assesses a specific property for a defined purpose; and a property inspection examines the home itself. Each serves a different purpose.
A report’s usefulness depends on your decision, when its data was collected and how its figures are defined. For general context on how local results sit within a wider national market, see this Australian property market overview.
What information does a suburb property report usually include?
Depending on the provider, a report may include sale prices, rents, sales volume and days on market. Some also cover demographic information, housing stock or local amenity indicators. Consider these separate clues, not a complete portrait: an area-wide figure may combine homes that differ in age, size, type and condition.
Reports may use different measures, time periods and definitions. A median sale price and a price-growth figure, for instance, describe different things. Before comparing results, check what each measure represents and which area it covers. The report’s publication date also doesn’t necessarily mean every figure reflects activity up to that date.
Who can use a suburb report, and for what decision?
Start with your purpose. A buyer might use local sales activity and price trends to frame questions about the market, then assess suitable properties individually. A seller can use suburb-level trends as context when considering sale timing and preparation, but they aren’t a direct estimate of the home’s value. Investors may review rents, sales activity and other relevant indicators, while recognising that suburb-wide figures can’t predict how a specific property will perform.
So, how to analyse a suburb property report? Read it as evidence that helps shape your next questions, rather than a verdict. For owners considering a sale, Kincade International Direct Sales provides neighbourhood market reports and property advice to connect broader market context with property-specific preparation.
How to Analyse a Suburb Property Report Step by Step
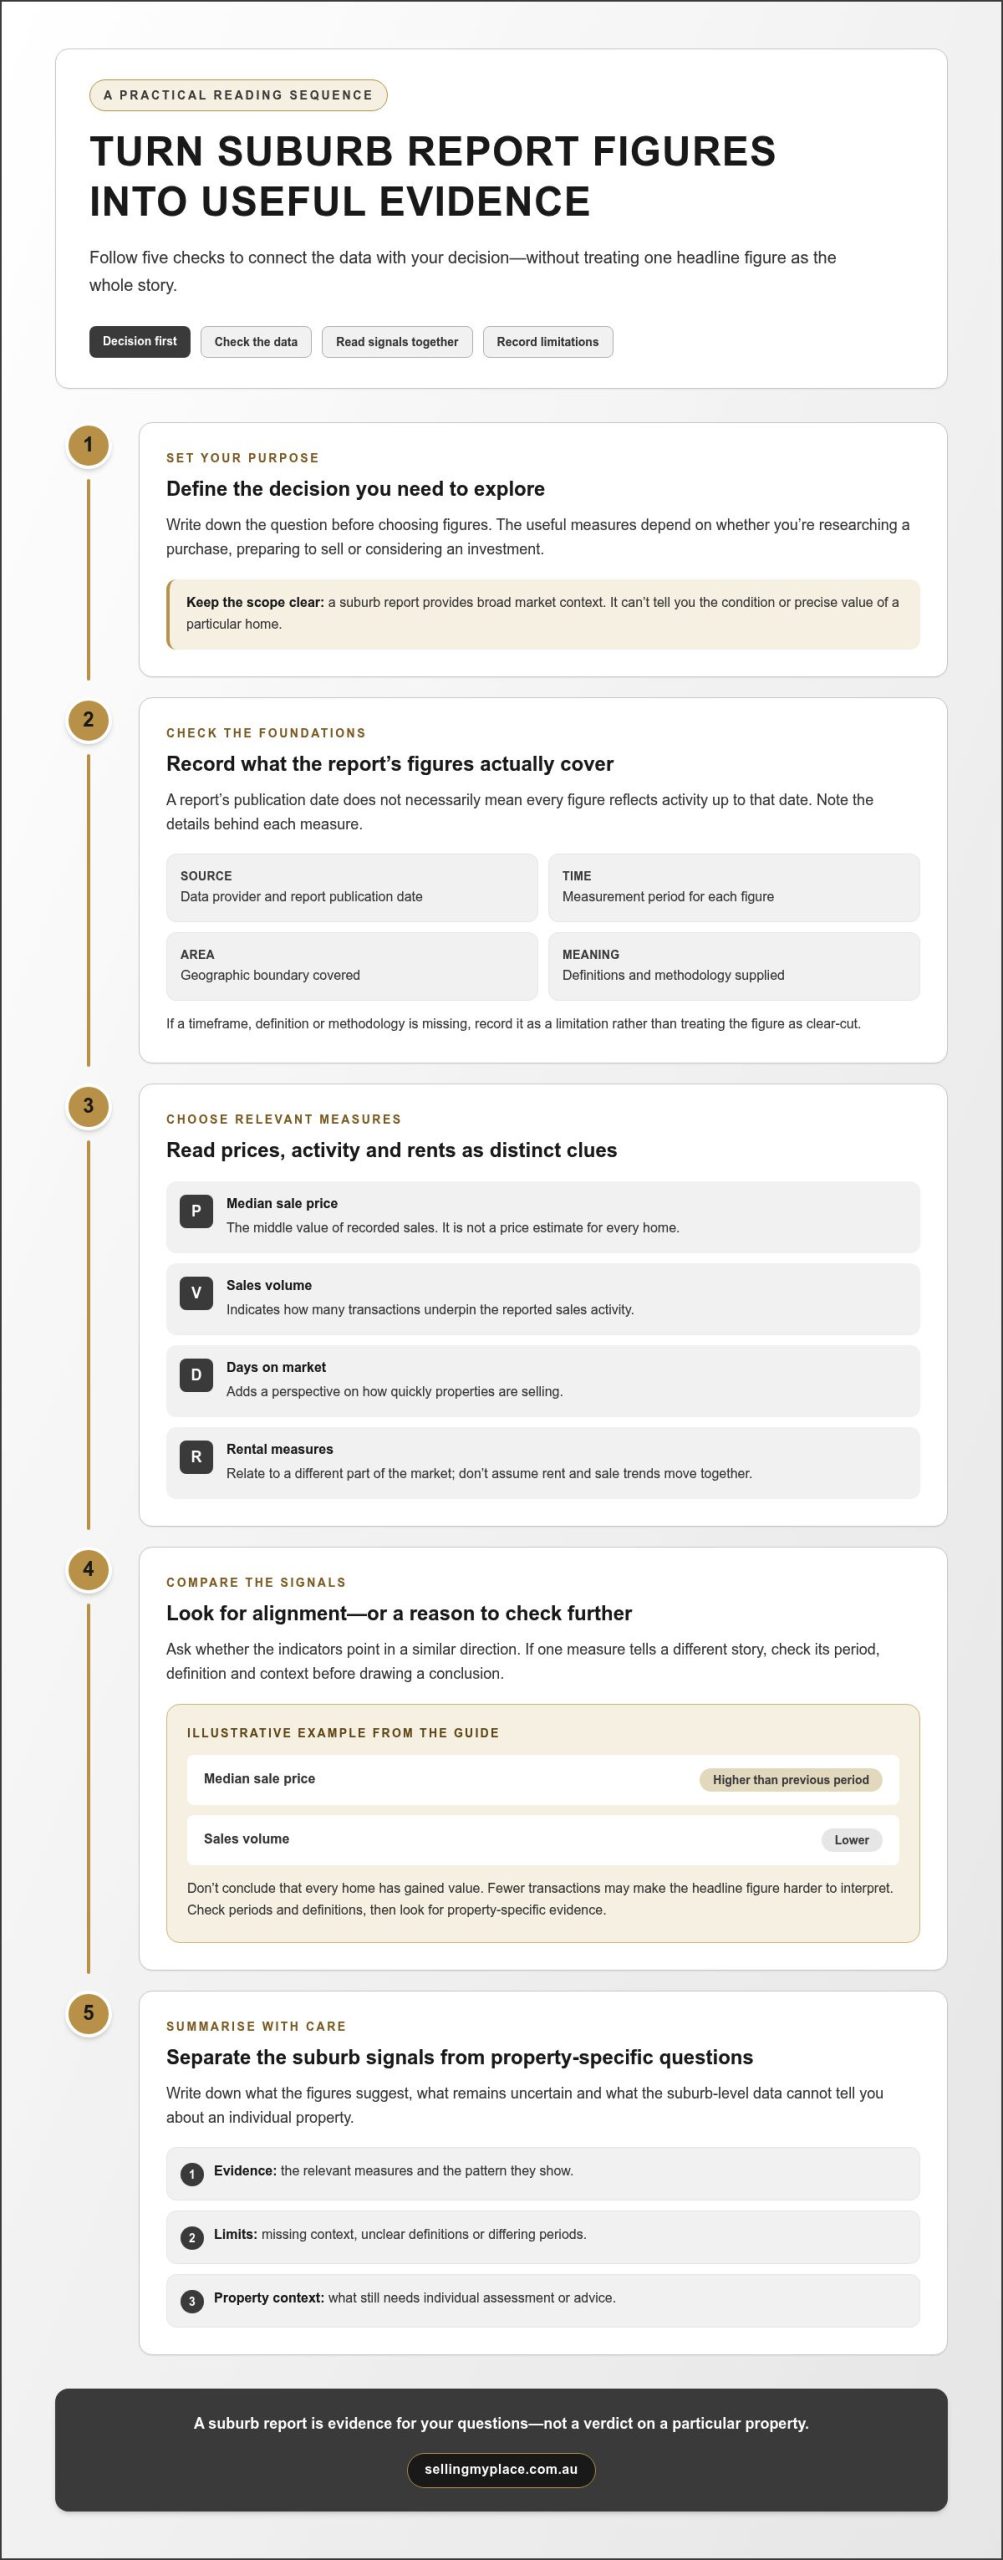
A consistent process turns a page of figures into useful evidence. If you’re learning how to analyse a suburb property report, begin with the decision in front of you, then check whether the data helps you explore it.
Start with the report’s date, source and definitions
Before interpreting a trend, note the report’s publication date, the measurement period for each figure and the data provider. Check the geographic boundary and whether the provider explains its methodology. A report published this month may still contain measures from an earlier period. If a definition or timeframe is missing, record that limitation rather than treating the figure as clear-cut. For wider context on housing and dwelling characteristics, the ABS housing data can help you understand the kinds of information available at a national level.
Read prices, rents and activity together
Median sale prices show the middle value of recorded sales, while sales volume indicates how many transactions underpin the reported activity. Days on market adds another perspective on how quickly properties are selling. Rental measures relate to a different part of the market, so don’t assume rent and sale trends move together.
One indicator can raise a question, but it can’t establish a market trend on its own.
Work through these steps:
- Define your decision. Are you researching a purchase, preparing to sell or considering an investment? Write down the question the report needs to help you explore.
- Record the report details. Note its publication date, data provider, measurement period, geographic boundary and any definitions or methodology supplied.
- Choose relevant measures. Select indicators that relate to your question, such as sale prices, sales volume and days on market for a selling decision. Treat rental figures separately if they’re relevant.
- Look for alignment or tension. Ask whether the indicators point in a similar direction, or whether one measure tells a different story that needs checking.
- Write down the limits. Record missing context, unclear definitions and what the suburb-level data can’t tell you about a particular property.
Illustrative example: Imagine a report shows a higher median sale price than the previous period, but sales volume is lower. Don’t conclude that every home has gained value. Fewer transactions may make the headline figure harder to interpret. Check the periods and definitions, then look for property-specific evidence before relying on the figure.
If you’re considering a sale, Kincade International Direct Sales’ neighbourhood market reports and property advice can help connect suburb-level context with questions about your home. Discuss your property plans as a practical next step.
How to Check Suburb Report Data and Compare Conflicting Signals
Two reports can describe the same suburb differently without either being wrong. Before deciding which figure to rely on, check whether both reports measure the same thing, over the same period and across the same area. This is a key part of how to analyse a suburb property report: test the comparison before drawing a conclusion.
Why can two suburb reports show different results?
Providers may update data at different times, draw suburb boundaries differently, group property types in different ways or use distinct calculation methods. Even a median sale price can shift if the mix of homes sold changes between periods. A higher median might reflect more sales of larger homes, for example, rather than a rise in the value of every property.
Note differences rather than averaging figures that aren’t directly comparable. A blended number can look precise while hiding important differences in source, period or definition.
Use a quick comparison check
| Check | Why it matters | What to note |
|---|---|---|
| Measurement period | Different time windows can show different market conditions. | The start and end dates for each figure. |
| Property type | Houses and units may have different sales patterns. | Which dwelling types are included. |
| Geographic boundary | Nearby areas or different suburb boundaries can change the results. | The location or boundary used by each report. |
| Metric definition | Similar labels may be calculated differently. | How the provider defines the measure. |
| Transaction activity | A small number of sales can make a result less representative of the broader market. | Sales volume and any sample-size caveat. |
Be cautious with an unexplained score or ranking, too. Without knowing the inputs, weightings and comparison group, a high score doesn’t establish that a suburb is a good choice for your needs.
Which Australian data sources can help with a cross-check?
The Australian Bureau of Statistics (ABS) provides demographic and Census context that can help explain population and housing characteristics. Commercial property data providers may use different datasets and methods, so read each report’s notes instead of assuming the figures are interchangeable. Public statistics, suburb reports and market commentary each offer a different perspective.
If you’re buying, keep your personal priorities and finances in view alongside suburb research. ASIC’s Moneysmart guide to buying a house provides broader guidance on the buying process. Use it as complementary context, not as a substitute for checking the definitions and limits of property data.
How to Apply Suburb Report Findings to Your Property Goal
A report becomes more useful when you connect its indicators to a decision you need to make. A buyer, seller and investor may read the same suburb data but need different answers. Keep your goal in view and separate broad market signals from details that only a property-specific assessment can reveal.
If you are preparing to sell, use suburb data as context
If you’re preparing to sell, use recent activity and sales of similar property types to understand the local backdrop and inform your preparation. Check whether the report covers homes genuinely comparable in type, rather than treating an all-property suburb median as a guide to your home’s likely result. A median summarises sales in an area; it isn’t a promised sale price or an individual valuation.
To explore how property-specific evidence can inform an estimate, read this 2026 Australian home value guide. When considering how to present and promote your home, the guide to professional residential property listing services can help you understand the marketing choices involved.
If you are buying or investing, test the report against your criteria
For a buyer, suburb indicators can frame questions about local sales activity or housing patterns. Compare those signals with the particular property’s features, condition and suitability for your needs. Your budget, plans and personal circumstances matter too; a suburb trend can’t tell you whether a home is the right fit.
An investor may consider sale and rental indicators in light of their objectives, but past performance isn’t a forecast of future results. A suburb-level figure also can’t establish the condition, costs or prospects of an individual property. Record what the report suggests, then list what it leaves unanswered, including property-specific risks that need further investigation.
That is the practical value of understanding how to analyse a suburb property report: use it to focus your next questions, not to make the decision for you. If you’re considering a sale, discuss your property plans and next steps.
Turn Your Suburb Property Report into a Clear Next Step
A useful analysis doesn’t need to produce a definite answer straight away. Its purpose is to clarify what the available evidence suggests, where it has limits and what you still need to find out. Bring those points together in a short written summary before acting.
Build a one-page summary before making a decision
Record the report’s publication date, data source and geographic scope, then write down the decision you’re weighing. This anchors the figures to your purpose and makes it easier to revisit your reasoning if circumstances change.
- Summarise the relevant signals: note the indicators that speak most directly to your goal and the direction they appear to suggest.
- Record the caveats: list differences between sources, unclear definitions, limited sales activity or other factors that may affect interpretation.
- Separate evidence from interpretation: label what the report directly shows, what you’re assuming and what remains unanswered.
- Identify your next question: decide what property-specific information or advice would help you move forward.
This record helps prevent a confident headline from overshadowing qualifications elsewhere in the report. It also gives you a practical starting point for a conversation with an adviser or further research.
When can a neighbourhood report or adviser add useful context?
A neighbourhood market report can organise relevant local context for an owner considering a sale. Kincade International Direct Sales’ pre-sale property consulting and real estate advisory support can help you think through preparation and sale decisions in light of that wider picture. Neither replaces an assessment of your individual home, and neither guarantees a particular sale price.
Keep the distinction clear: a suburb report supports your research; it doesn’t assess your property’s condition or establish its specific value. Those questions need property-specific consideration alongside the wider market signals.
The final step in how to analyse a suburb property report is to turn your notes into a measured next move: summarise the signals, acknowledge their limits and identify what you need to learn next. If you’re weighing a sale, discuss your property goals and explore how Kincade International Direct Sales’ flat-fee marketing and advisory services can support your plans.
Make Your Next Property Decision with Clarity
Learning how to analyse a suburb property report starts with looking beyond the headline: check dates and definitions, compare relevant indicators, and consider what the figures can and can’t tell you. Use the report to frame better questions, not as a stand-alone verdict on a suburb or an individual home.
For owners weighing a sale, neighbourhood market reports can organise local context, while pre-sale consulting and real estate advisory services can support decisions about preparation and next steps. Kincade International Direct Sales offers flat-fee property marketing with no agency commission, including professional photography and floorplans, alongside advisory support.
Ready to put your findings into perspective? Talk through your property goals with Kincade International Direct Sales and explore a clear next step for your sale.
Frequently Asked Questions
What should I look for in a suburb property report?
Focus on measures that relate to your decision, such as sale prices, sales volume and days on market, or rents if rental conditions matter to your research. Check the report’s publication date, measurement periods, geographic boundaries and metric definitions before interpreting a trend. Look for limitations too, including low sales activity or a small sample. A suburb-wide figure offers context, not an assessment of an individual home.
How do I know whether a suburb property report is up to date?
Check the report’s publication date and, separately, the period covered by each measure. A recently released report may still include figures collected earlier, so look for the latest date of the underlying data and the provider’s update notes. If a measure has no clear timeframe, treat it cautiously and record that limitation. Compare only figures covering relevant, matching periods rather than assuming every page was updated at once.
Why do different suburb reports show different property figures?
Reports can differ because providers use different datasets, update schedules, suburb boundaries, property categories and calculation methods. A median sale price may also shift if the types of homes sold changed between periods. For example, a period with more sales of larger homes could affect the median without showing that every property increased in value. Note these differences rather than averaging figures that aren’t directly comparable.
Can a suburb property report predict future property prices?
No. A suburb report describes selected data and past or current patterns; it can’t reliably tell you what prices will do next. Trends may help you frame questions, but they aren’t a forecast or a guarantee of future results. Consider what the figures cover, how recent the underlying data is and whether other indicators support the same interpretation. Keep any outlook separate from what the report directly records.
Is a suburb report enough to decide whether to buy a property?
No. A suburb report can help you understand broader market context, but a buying decision also depends on the particular property, its condition, your priorities and your financial circumstances. Use the report to develop questions, then assess the home itself and investigate any material concerns. A suburb-level median, for instance, can’t establish the value or suitability of a specific property. Treat the report as one part of your research.
Which Australian data sources can I use to cross-check a suburb report?
The Australian Bureau of Statistics (ABS) is useful for demographic, Census and housing context. Commercial property data providers such as CoreLogic, Domain and PropTrack publish market information, but their datasets and methods can differ. Public statistics, commercial reports and market commentary can complement one another, but they don’t measure the same things. Compare their dates, boundaries and definitions before drawing conclusions, and avoid combining figures that aren’t like for like.
How should a seller use a suburb property report?
A seller can use a suburb property report to understand local market context and consider which recent activity or comparable property types may be relevant to preparation and timing. It shouldn’t be treated as a direct estimate or promised sale price for an individual home. Check the report’s dates and limitations, then consider property-specific factors. Kincade International Direct Sales’ neighbourhood market reports and pre-sale consulting can help owners organise market context and think through sale preparation.